Debugging
Opening Devtools
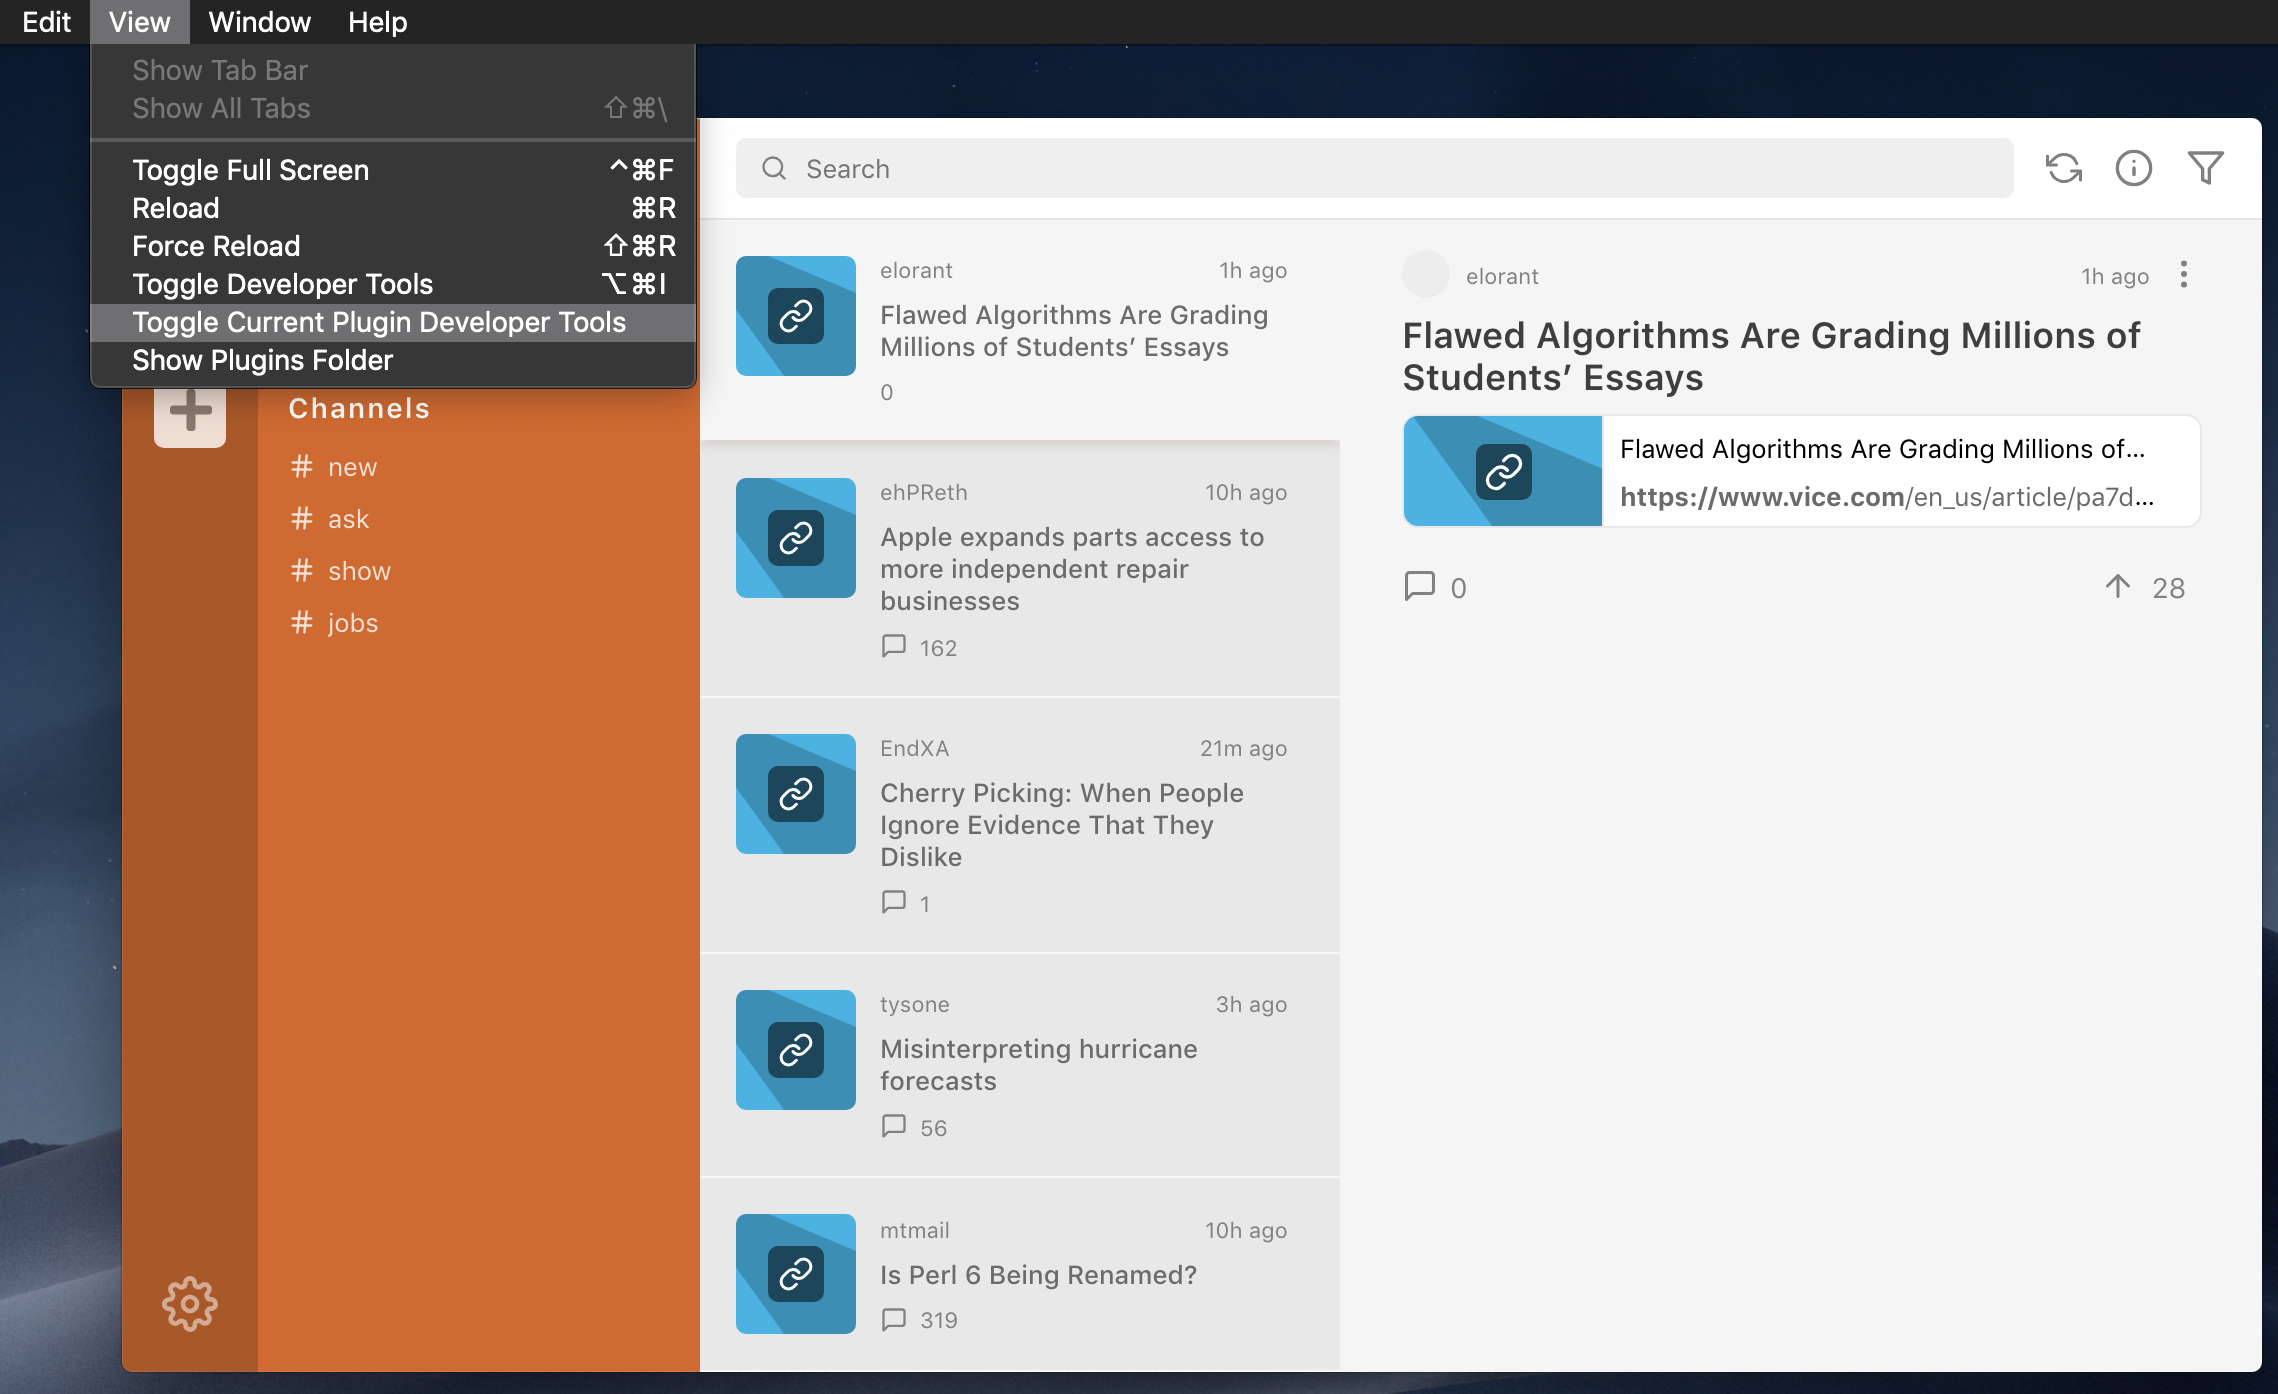
Ensure Developer Mode is enabled in app and that you’ve built your new Yack Connector following the instructions in the Running Your Connector section. After adding your new Connector navigate to it within the app. Then, in the top window navigation menu go to View -> Toggle Current Plugin Developer Tools
Console Logging
Setting the Yack Beta app into Developer Mode will enable built-in Chrome debugging tools and ability to proxy requests. The best way to debug your code is by using a combination of console.log(), console.warn(), and console.error(). Although, it is still possible to use these console logging methods directly it’s a much better practice to use the console tools passed down to the plugins from the PluginContext.
Console Debug/Log
this.pluginContext.logger.d("Log something");
Console Info/Warn
this.pluginContext.logger.i("Log something");
Console Error
this.pluginContext.logger.e("Log something");
ℹ In Yack’s current beta architecture breakpoints and hot reloading for debugging purposes does not work.
Important: Plugin Refreshing
Using cmd + R with your connector focused in-app will refresh the entire connector. However, it’s highly recommended to first open the connector’s devtools instance then navigate to the Console tab and press cmd + R. Refreshing from the connector’s devtools console will ensure that console debugging messages will show the exact file location of the error message.
Clearing Cache
ℹ Not to be confused with browser cache.
Occasionally local files may not clear correctly upon build causing your changes to not be represented in-app.
macOS ▸ Users ▸ [YOUR_USERNAME] ▸ Library ▸ Application Support ▸ Yack-Staging
From a new bash terminal you can quickly remove all cached plugin information by running:
cd "$HOME/Library/Application Support/" && rm -R Yack-Staging